Computer skills from scratch·Standing taller·Lesson 158 of 180
The pivot table, properly
 Ellis Dennis GrahamFounder, Cyber Elias Academy 2026-09-10 4 min
One thousand rows in, three sentences out, without touching a formula: select, drag, read. The spreadsheet's most respected tool, walked slowly in the series voice.
The data analyst lesson named the pivot table as the most respected spreadsheet skill in the room. This lesson teaches it, slowly, because the respect is deserved and the fear is not: the pivot table is one of those machines that looks like sorcery and is actually a lever. Ten minutes here replaces hours of formula-copying, and the summary it builds never lies about where it came from.
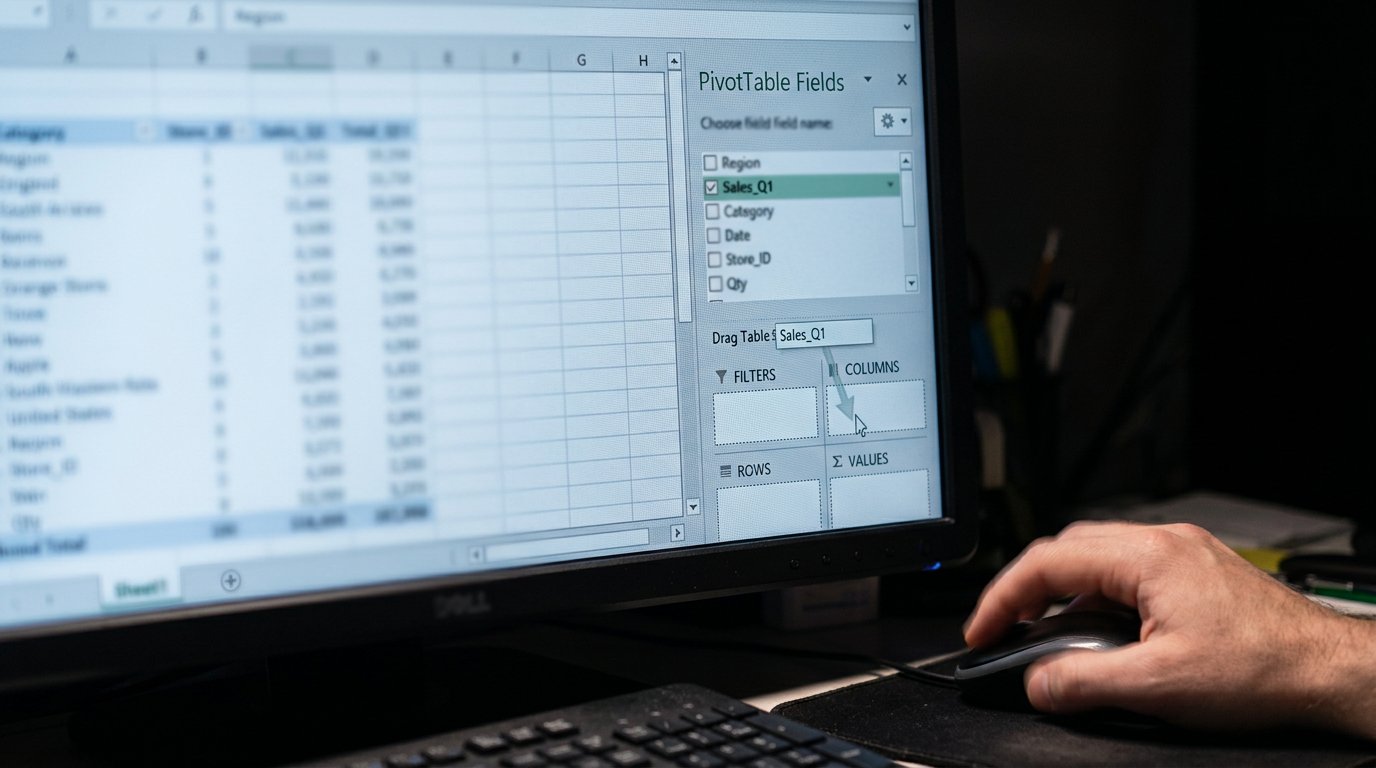
Picture the raw material first, because every pivot begins the same way: one solid block of rows — a thousand sales, a term's fees, a month's transactions — with one clean header row on top: Date, Item, Amount, Branch. Clean means the sorting lesson's rules: no merged cells, no blank columns inside, no notes wandering in row 40. Then the whole act: click once inside the block, choose Insert, then Pivot Table, and tell it where the new summary should live. The spreadsheet now offers you a small panel with four trays — Rows, Columns, Values, Filters — and the whole craft is dragging fields between trays and watching the summary rebuild itself. That is all a pivot is: a machine that groups your rows and counts or adds them, at your instruction, in seconds.
A worked example, walked
Drag Item into Rows, and the table lists every product once, neatly, instead of the thousand messy times it appears in the data. Drag Amount into Values, and it adds the money beside each product — the machine chooses Sum because Amount is money; if you drag a column of names instead, it counts them, which is how you answer how many, not how much. Drag Branch into Columns, and the totals split side by side: this product, per branch, meeting in the corner cell. Drag Date under Rows above Item, and the months stack into a story of the year. Every question a small business asks its books — what sells, where, when, how much — is two or three drags away, and the pivot lesson's punchline is the analyst lesson's too: the summary is a lens, not a copy. Change nothing in the original block; refresh the pivot when the data grows, and the lens re-focuses itself. Formulas typed by hand into the summary cannot make that promise — a pivot's answer is always one refresh away from the truth.
Then the finishing manners: sort the result — the biggest number to the top, the answer the boss actually asked; give the summary a title that states the question, June sales by branch, not PivotTable4; and where the summary must travel, copy it as values into a fresh sheet or PDF, the way every document on this shelf travels. Practise once on any data you own — the shop's book, the house expenses from lesson eighty-four — and you will feel the moment every analyst remembers: the thousand rows became one sentence, and you did not type a single formula. That moment is the door to lesson one hundred and thirty-one's whole career.
- Clean the block first: one header row, no merges, no strays. The pivot is honest; it only summarises what is there.
- Walk the drags in order: Item to Rows, Amount to Values, Branch to Columns, Date to stack the months.
- Remember the lens rule: change nothing in the original data; refresh and the answer re-focuses.
- Title the summary with its question and sort it biggest-first. A pivot that needs explaining has a bad title, not a bad table.
The lever, not the magic
Nothing here required genius — only the willingness to select, drag and read, which you have been doing since the sorting lesson. That is the quiet joke of the spreadsheet world: its most respected tool is a two-minute skill wearing a fearsome name. Learn it once on your own books, and the next time somebody dumps a thousand rows in your lap and asks for the summary by Friday, you will smile the analyst's smile and say: give me five minutes.